

Authors:
- Ashley Prentice, Forest Carbon Specialist, Colorado State Forest Service
- Ethan Bucholz, Ph.D., Forest Monitoring Program Manager, Colorado State Forest Service
- Steve Rudolph, Wood Utilization and Marketing Program Specialist, Colorado State Forest Service
- Dan West, Ph.D., Forest Entomologist, Colorado State Forest Service
- Maggie Gracia, Forest Inventory and Analysis Crew Member, Colorado State Forest Service
Editor:
- Amanda West Fordham, Ph.D., Associate Director, Science and Data Division, Colorado State Forest Service
Key takeaways
- Fifty-four percent of trees per acre were in medium to very large diameter classes (≥ 6 inches), which are more susceptible to mountain pine beetles. Those classes made up 93% of total ponderosa basal area.
- Jefferson, Douglas, Larimer, Boulder and El Paso counties stand out as they repeatedly showed the largest projected susceptible acreage and volume.
- Potential volume could ramp up depending on how quickly and far the beetle moves over the next few growing seasons (1 km or 2.5 km). Under a slower relative rate of spread (i.e., 1 km) with light infestation, potential volume impacted is around 60,000 CCF, compared to about 879,000 CCF under a faster (2.5 km) spread with more severe infestation.
- Based on the Bureau of Business and Economic Research’s 2020 census, estimated annual Front Range roundwood processing capacity is only about 54,000 CCF, meaning even the light 1 km scenario would exceed that capacity (est. 58,000 CCF).
Table of Contents
Introduction
Mountain pine beetle (Dendroctonus ponderosae, hereafter MPB) is a native bark beetle that affects several pine species throughout the Rocky Mountain West. At low population levels, MPB plays a crucial ecological role as a natural disturbance agent, generally killing weakened/stressed individuals. But when populations increase rapidly to epidemic levels, it can cause extensive tree mortality, altering forest structure and composition for decades. Colorado recently experienced an MPB epidemic that affected lodgepole pine and ponderosa pine forests, impacting roughly 3.4 million acres between 1996-2013 (Negrón & Cain, 2019). This previous epidemic was associated with a combination of drought stress, warmer winter temperatures and abundant host trees of susceptible size, which together enabled rapid population expansion and subsequent mortality (Negrón & Cain, 2019).
Recent increases in visible MPB populations and mortality in ponderosa pine forests along the Colorado Front Range have renewed concern about the potential for more extensive impacts. This area is the easternmost section of the Rocky Mountains and the most densely populated area of the state. In response, Gov. Polis signed an executive order to mobilize resources and support coordinated action, including the formation of the Ponderosa Mountain Pine Beetle Task Force.
Although current MPB infestations are localized and have not yet reached epidemic levels, activity detected from yearly aerial surveys conducted by the Colorado State Forest Service (CSFS) and USDA Forest Service (USFS) across nine neighboring Front Range counties indicates a need to better understand current conditions and possible future impacts. This includes not only the potential extent of tree mortality and immediate mitigation needs, but also whether existing regional infrastructure has the capacity to utilize material generated through management or tree death and respond to associated hazard concerns.
This Science & Data Byte complements the 2025 Report on the Health of Colorado’s Forests by providing a detailed assessment of ponderosa pine forests with elevated MPB activity and mortality along the Front Range. Aerial Detection Survey (ADS) data indicate where visible MPB-caused mortality has occurred, but they do not describe stand conditions or estimate the amount of ponderosa potentially affected. Forest Inventory and Analysis (FIA) data provide county-level information on forest conditions, while FIA spatial data can help translate those conditions into mapped MPB-affected and scenario-based spread areas. Because no single dataset fully captures the current situation, this unique combination of data sources provides useful context for evaluating current conditions, potential impacts and related processing capacity considerations. It also highlights the strength of bringing together multiple federal and state-led programs to provide a resource to address ongoing natural resource management concerns. Not only does the CSFS partner with the USFS to collect ADS and FIA data in Colorado, multiple CSFS staff across four programs within the CSFS completed this analysis.
The nine counties assessed in this report include Boulder, Clear Creek, Douglas, El Paso, Gilpin, Jefferson, Larimer, Park and Teller.
The objectives of this Science & Data Byte are the following:
- Describe current conditions of ponderosa pine trees within ponderosa-dominant stands, including acres, basal area, trees per acre and diameter distributions.
- Use ADS data to estimate the current extent of MPB activity and determine potential spread scenarios based on MPB flight behavior.
- Estimate the range of ponderosa volume affected under current MPB outbreak acreage and spread scenarios using spatial FIA data products.
- Compare volumes from severity scenarios to estimate processing capacity for biomass facilities within the broader area of these nine counties.
The results presented in this Science & Data Byte are estimates of current forest conditions and scenario-based estimates of potential impact. They should not be interpreted as predictions of exact future mortality, timing or location of MPB-caused tree death. Rather, they are intended to help frame the current extent of visible activity, characterize forest conditions in affected counties and illustrate the potential range of volume and infrastructure considerations if MPB activity expands.
Current ponderosa conditions
Current ponderosa conditions were summarized using FIA plot data collected between 2014-2023. Estimates were generated for ponderosa-dominant stands within the nine Front Range counties of interest. Because these FIA summaries are based on sampled plots within each county rather than a complete census, estimate uncertainty varies among counties depending on plot availability. Additional information about the FIA program and the detailed methods used in this analysis is provided in the Appendix.
Larimer, Jefferson, Park and Boulder counties contain the most ponderosa pine-dominant acreage among our nine counties (Table 1). Of those counties, Jefferson, Boulder and Larimer ponderosa-dominant stands also account for a notable share of total forested land, ranging from 22% to 32%. Gilpin and Clear Creek counties had the least amount of ponderosa-dominant acreage, and each contained only one ponderosa-dominant FIA plot, so estimates should be interpreted cautiously (Table 1).
| County | Ponderosa dominant acres (PSE) | Percent of forested land in ponderosa-dominant stands | Trees per acre (PSE) | Basal area per acre (ft2/ac) | Number of FIA plots |
|---|---|---|---|---|---|
| Boulder | 70,752 (22) | 31 | 191 (37) | 57 (15) | 17 |
| Clear Creek | 6,216 (98) | 4 | 120 (0) * | 87 (0) * | 1 |
| Douglas | 52,441 (34) | 21 | 140 (25) | 57 (14) | 10 |
| El Paso | 62,804 (26) | 30 | 166 (24) | 74 (15) | 13 |
| Gilpin | 6,010 (100) | 7 | 276 (0) * | 58 (0) * | 1 |
| Jefferson | 93,482 (22) | 32 | 110 (17) | 73 (11) | 15 |
| Larimer | 190,882 (15) | 22 | 144 (16) | 55 (10) | 35 |
| Park | 91,749 (23) | 14 | 104 (29) | 47 (10) | 20 |
| Teller | 63,415 (29) | 24 | 74 (26) | 43 (10) | 11 |
* = Sample percent standard error (PSE) is undefined for estimates generated from one plot. These values should not be interpreted as highly precise; rather they reflect insufficient sample sizes to estimate uncertainty.
Estimates of trees per acre were highest in Gilpin, Boulder and El Paso counties, and estimated basal area per acre was highest in Clear Creek, El Paso and Jefferson counties (Table 1). Although county-level average basal area does not by itself define MPB susceptibility, Negrón and Popp (2004) identified elevated infestation risk in stands with ponderosa pine basal area are above 74 ft2/acre; Clear Creek exceeded that level, and El Paso and Jefferson were near it, suggesting that conditions associated with elevated risk are present in parts of the region (Table 1).
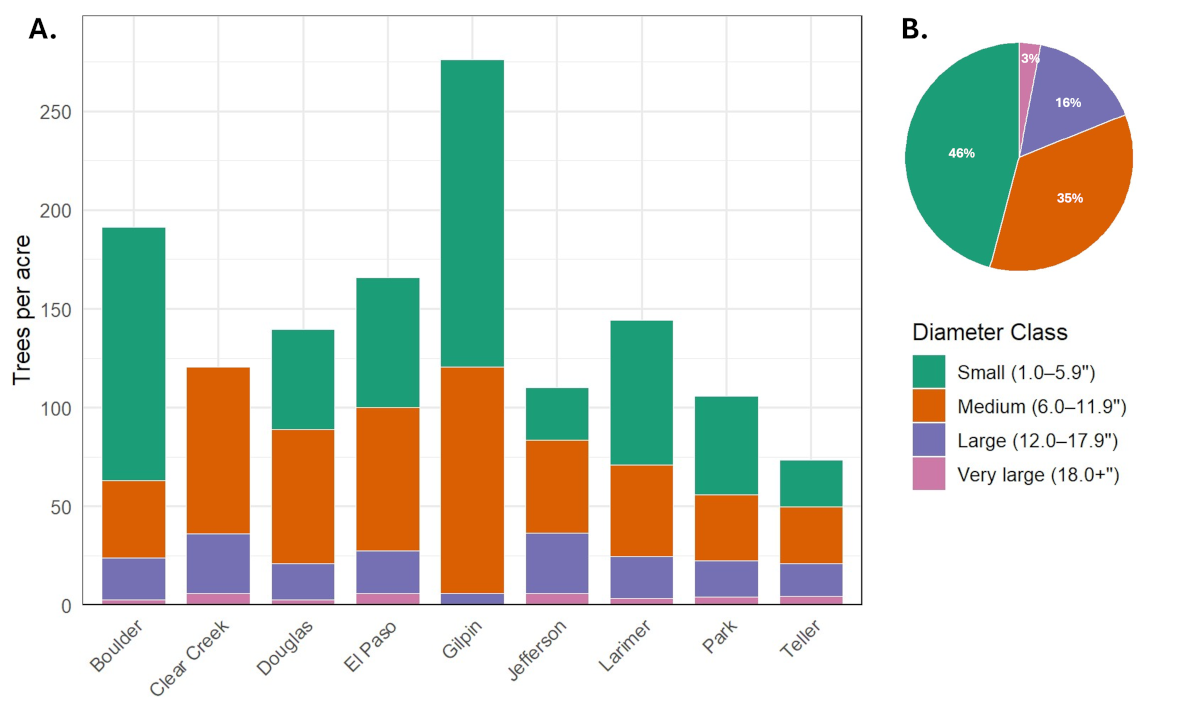
County-level trees per acre (TPA) and basal area, organized by tree size class, based on individual tree diameter, reveal important facets. Small trees were often the most numerous size class in terms of TPA (Figure 1); however, this relationship is highly variable across counties. Generally, higher TPA in smaller size classes indicates the presence of some age-class diversity, with the relative magnitude of the difference being far greater for the most age-diverse stands, and more homogenous for more even-aged stands. For our analysis, the fact that small trees comprise just under 50% of the overall TPA averaged across counties, and that several counties have a roughly equal allocation of TPA across our size classes, suggests that ponderosa pine-dominant acreages exhibit little age-class diversity (Figure 1).
This becomes more apparent when considering basal area allocation. Across the nine counties, 54% of trees per acre were in the medium, large and very large diameter classes, and those same classes accounted for 93% of total ponderosa basal area (Figures 1 and 2). This distinction is important because MPB generally targets “larger diameter” trees, and current field observations by CSFS staff in this area suggest attacks are occurring primarily in trees greater than 6 inches DBH.
As a result, even where small trees are abundant, much of the standing ponderosa structure is concentrated in the size classes most likely to be attacked and most likely to contribute to mortality, hazard and volume impacts during an outbreak. Taken collectively, Colorado’s Front Range ponderosa pine-dominant forests are largely homogenized toward susceptible size classes and are at high risk for infestation intensification.

Current MPB-affected area
Annual monitoring for the damage caused by forest insects is a necessary component of forest management. The primary source of information on forest pest conditions in Colorado is the annual Aerial Detection Survey. This cooperative program is conducted by specialists from the USDA Forest Service (USFS) and Colorado State Forest Service (CSFS). Trained observers representing both agencies fly over the state’s native forests in small aircraft to map and classify the current year’s damage intensity. Some areas flown during the aerial survey also are ground-checked to verify the agent responsible for the damage and its severity.
Using 2025 aerial survey data from the USFS and CSFS, mapped MPB outbreak polygons in ponderosa pine forests totaled 5,544 acres across the Front Range analysis area. In addition to polygon extent, the aerial survey includes severity ratings that describe the estimated infestation severity within each mapped polygon. Because not every acre within a mapped polygon is necessarily affected, severity adjustments were applied to better approximate the portion of each polygon currently affected by MPB. After applying severity adjustments, the estimated currently affected area was reduced to 1,190 acres (Table 2). Severity-adjusted outbreak acreage varied across counties, ranging from 4 acres in Larimer County to 491 acres in Jefferson County, with the largest affected areas in Jefferson, Park, Clear Creek and Boulder counties. Additional information on the 2025 aerial survey is available in Colorado’s annual forest health report.
| County | Mapped outbreak acres | Severity-adjusted outbreak acres |
|---|---|---|
| Boulder | 601 | 171 |
| Clear Creek | 650 | 180 |
| Douglas | 283 | 35 |
| El Paso | 287 | 64 |
| Gilpin | 265 | 44 |
| Jefferson | 2,095 | 491 |
| Larimer | 126 | 4 |
| Park | 1,167 | 195 |
| Teller | 70 | 6 |
| Total | 5,544 | 1,190 |
Potential MPB spread and susceptible acreage
Whereas the previous section summarizes the currently detected outbreak area, this section estimates the amount of ponderosa pine acreage within potential spread zones that are associated with stand conditions linked to elevated MPB susceptibility. Potential MPB spread was evaluated using 1 km and 2.5 km projection scenarios, following Withrow et al. (2013), to estimate the area of ponderosa pine that could be affected if beetle activity expands outward from currently detected locations.
Within these potential spread scenarios, FIA-linked TreeMap data were used to identify acres associated with stand density index, quadratic mean diameter and basal area thresholds linked to elevated MPB susceptibility, following Negrón and Popp (2004). Because this analysis relied on FIA plots and plot-linked TreeMap pixels, we applied their plot-level classification tree to identify plots meeting structural conditions corresponding to an estimated MPB infestation probability of 73% or greater. Unlike the severity-adjusted aerial survey acres presented in the previous section, these values do not represent currently observed MPB activity or mortality. Rather, the values presented here represent acres within each scenario where TreeMap-linked FIA plots met structural conditions associated with elevated susceptibility. These values should not be interpreted as observed infestation or mortality, but areas that we are likely to see infestation intensification given proximity to ongoing outbreaks. Additional information about TreeMap and detailed methods used for this analysis, including a map showcasing the areas in this analysis, is provided in the Appendix.
Across all counties, 49,127 acres under the 1 km projection scenario and 112,215 acres under the 2.5 km projection scenario met Negrón and Popp (2004) susceptibility thresholds. However, just because an area was identified at higher risk of infestation does not mean that those acres will become infested. Therefore, we applied acreage deductions to represent levels of infestation consistent with the severity estimation from the aerial survey (Table 3). This represented a range from light (6% of individuals within a given area impacted) to severe (40% of individuals) infestation, thereby representing a range of acres that could potentially be impacted as MPB spreads from current infestation centers into these surrounding areas. Counties with the greatest projected acreage meeting susceptibility thresholds included Jefferson, Douglas, Larimer, Boulder and El Paso (Table 3). Full acre estimates and additional deduction scenarios are available in the Appendix.
Projected acreage meeting susceptibility thresholds did not always align with the amount of currently detected outbreak areas in Table 2. Jefferson County had high acreage meeting thresholds across both projected spread scenarios, while counties such as Larimer and Douglas had relatively limited acres currently impacted (Table 2) but substantially larger acreages meeting susceptibility thresholds under the 1 km and 2.5 km projections. This suggests that some counties with low currently detected MPB activity may also contain significant acreages with elevated susceptibility.
| Scenario | Boulder | Clear Creek | Douglas | El Paso | Gilpin | Jefferson | Larimer | Park | Teller | Total |
|---|---|---|---|---|---|---|---|---|---|---|
| 1 km spread: Light (6%) | 238 | 142 | 542 | 306 | 85 | 1,032 | 344 | 116 | 143 | 2,948 |
| 1 km spread: Severe (40%) | 1,590 | 948 | 3,613 | 2,037 | 567 | 6,878 | 2,294 | 774 | 952 | 19,651 |
| 2.5 km spread: Light (6%) | 708 | 230 | 1,287 | 613 | 107 | 1,984 | 1,126 | 281 | 399 | 6,733 |
| 2.5 km spread: Severe (40%) | 4,718 | 1,534 | 8,579 | 4,088 | 711 | 13,224 | 7,504 | 1,872 | 2,658 | 44,886 |
Potentially affected ponderosa pine volume
Standing live ponderosa pine volume was estimated only for TreeMap pixels linked to FIA plots that met the Negrón and Popp (2004) susceptibility thresholds. These threshold-qualified pixels were then summarized within the current outbreak footprint and the 1 km and 2.5 km projection scenarios. These estimates represent the volume of live ponderosa pine trees 6 inches DBH and larger and were not limited to ponderosa-dominant stands. This approach recognizes that susceptible ponderosa pine also can occur within stands classified as other dominant forest types, such as Douglas-fir, including areas adjacent to ponderosa-dominant stands.
To avoid implying that all standing live ponderosa pine volume within a mapped area would be affected, volume estimates were adjusted using percent deduction factors representing various levels of potential impact. Full volume totals, alternative deduction scenarios and detailed methods are provided in the Appendix. In addition, volume estimates presented here represent the potential volume that would be removed/impacted over the progression of MPB infestation, not just representing potential mortality, but encompassing management activities like preemptive forest thinning and sanitation, in addition to direct MPB mortality.
Ponderosa pine volume within the aerial survey outbreak footprint meeting Negrón and Popp (2004) susceptibility thresholds totals 12,846 CCF (Table 4). This increases substantially under projected spread scenarios. A light MPB infestation (6%) within the 1 km spread scenario results in nearly 58,000 CCF of volume impacted (Table 4). Under the 2.5 km spread scenario, this nearly triples to 131,870 CCF of volume potentially impacted. The counties with the highest amounts of susceptible volumes under either spread rate within the light infestation scenario are Jefferson, Douglas, Larimer and El Paso counties, suggesting significant impacts to these forests if infestation builds over the next several years.
Under a severe MPB infestation (40%), estimated impacted volume increases dramatically, roughly 6.5 times greater than the light scenario. An estimated 386,377 CCF within the 1 km projection scenario and 879,136 CCF within the 2.5 km projection scenario could be affected. The largest projected susceptible volumes occurred in Jefferson, Douglas, Larimer, Boulder and El Paso counties. These estimates should be interpreted as an index of potentially affected standing live ponderosa volume within current and projected outbreak areas, rather than rigorously predicted mortality or certain recoverable volume.
| Scenario | Boulder | Clear Creek | Douglas | El Paso | Gilpin | Jefferson | Larimer | Park | Teller | Total |
|---|---|---|---|---|---|---|---|---|---|---|
| Current outbreak | 1,083 | 1,150 | 1,700 | 2,583 | 485 | 4,922 | 443 | 338 | 142 | 12,846 |
| 1 km spread: Light (6%) | 4,655 | 2,341 | 11,278 | 6,590 | 1,476 | 19,724 | 7,884 | 1,837 | 2,174 | 57,957 |
| 1 km spread: Severe (40%) | 31,033 | 15,604 | 75,186 | 43,932 | 9,837 | 131,493 | 52,558 | 12,244 | 14,490 | 386,377 |
| 2.5 km spread: Light (6%) | 13,941 | 3,803 | 26,107 | 12,460 | 1,844 | 39,232 | 23,935 | 4,447 | 6,102 | 131,870 |
| 2.5 km spread: Severe (40%) | 92,943 | 25,352 | 174,045 | 83,064 | 12,294 | 261,544 | 159,569 | 29,645 | 40,681 | 879,136 |
Front Range processing capacity
The capacity to utilize ponderosa pine material generated through MPB management depends in part on the processing infrastructure and existing markets available across the Front Range. To provide context for the estimated MPB-related volume presented in this Science & Data Byte, we summarized annual processing capacity for Front Range facilities and compared that capacity to projected volume under current and potential spread scenarios. Estimated capacity by county group is shown in Table 5.
| County group | Annual capacity (CCF) |
|---|---|
| Adams & Denver | 3,463 |
| Boulder | 2,085 |
| Fremont & Pueblo | 28,151 |
| Larimer | 13,454 |
| Park | 4,564 |
| Teller | 2,536 |
| Total | 54,253 |
These data were gathered by the University of Montana’s Bureau of Business and Economic Research (BBER) from its 2020 survey. Only facilities that run exclusively on roundwood feedstock are presented here, because those with mixed inputs (roundwood and non-roundwood) can vary widely in their proportion of roundwood and non-roundwood feedstock from year to year. This capacity assumes firm market demand, sufficient raw material and ordinary downtime for maintenance (personal communication with B. Irey, 2026).
While this capacity shows the potential wood utilization of Front Range facilities, it is not likely that all this demand could be filled by ponderosa pine. Ponderosa pine is generally not preferred by sawmills with access to other softwoods, like lodgepole pine and spruce, due to limitations including its strength, the size and frequency of knots, time it takes to dry and potential to warp when drying. Ponderosa pine only comprised 14.6% of the timber harvested in Colorado in 2020, a distant third behind spruce (39.7%) and lodgepole pine (26.2%) (Irey et al., 2025).
It is worth noting that more than half of the roundwood processing on the Front Range falls in Fremont and Pueblo counties, well outside of the current nine-county focus area. While the southern end of the focus area may be within a reasonable haul distance to these areas, it would likely be cost prohibitive for these mills to source material from the northern Front Range, especially at current fuel prices. There are also roundwood processing facilities outside of Colorado’s borders, including in Albany County, Wyo. Albany County’s facilities provide an estimated 3,097 CCF of capacity, but hauling material here would likely only be cost effective from the northern reaches of the Front Range focus area.
Comparing this annual processing capacity to projected MPB-related volume provides a useful context. Under the 1 km spread, the light severity scenario yields an estimated 57,958 CCF, which exceeds the annual roundwood feedstock capacity of 54,253 CCF across Front Range facilities.
To further refine the estimate of total wood consumption along the Front Range, the CSFS Wood Utilization & Marketing Program reached out to additional businesses that were not included in BBER’s 2020 census, including community-run and for-profit mulch facilities, sawmills and firewood producers. Based on their responses and understanding of Front Range markets, we estimate an additional processing capacity of approximately 30,000 CCF within the nine-county focus area and adjacent counties; however, is it unlikely that this additional capacity will shift to consume a substantial amount of beetle-killed ponderosa pine.
First, much of this capacity consists of mulch operations, and while these operations have more flexible species and wood-quality specifications than a sawmill, many have top-end diameter restrictions that would exclude the use of trees at the highest risk of MPB-caused mortality: those in the large, very large and even the upper end of the medium size classes. Second, many of these facilities are largely supplied by residential and municipal fire mitigation and tree work activity, so an influx of MPB-killed ponderosa pine would only supplant this material and trade one wood utilization challenge for another.
The CSFS provides an online Front Range disposal map for MPB-infested wood, showing facilities that accept infested material by load size and by private versus municipality-owned operation. Because site availability and restrictions may change, users should confirm current conditions directly with the receiving facility.
Discussion and conclusion
Currently, across nine Colorado Front Range counties, MPB activity is relatively low albeit increasingly visible. From a proportion of county acreage, most of the current outbreaks occupy less than 1% of their total ponderosa pine-dominant acreage, except for Clear Creek County, where 2.8% of their ponderosa pine acreage is currently impacted, using severity-adjusted aerial survey acreage (Table 2). While these numbers are low, thinking about potential expansions of 1 km and 2.5 km over the next few years, the amount of impacted acreage may dramatically increase due to the presence of many spot infestations across these landscapes (Table 3). While current volumes impacted presently within outbreak centers are relatively small, this too is subject to dramatic growth depending on how quickly MPB moves through these areas.
Warmer winter temperatures favor MPB larval survival and development, while cold winter temperatures often present bottlenecks to MPB population growth (Amman, 1973). The winter of 2025-2026 was one of the warmest winters since Colorado temperatures were first recorded in 1895 and showcased a statewide snow drought (NOAA, 2026; Schumacher, 2026). Snowpack often provides critical early season moisture for lower-elevation forests, suggesting that, even with some welcome precipitation this spring, ponderosa pine forests will be drought stressed earlier and potentially for longer this summer. Given this climate reality and the fact that ponderosa pine forests within the nine-county analysis region are largely comprised of individuals at highest risk for infestation, this does not suggest the outbreak will begin to wane anytime soon.
Our volume estimates suggest that under low levels of infestation, Front Range mill capacity to utilize materials generated will be overwhelmed. The volumes presented represent a combination of potential future management and impact responses, rather than any single treatment type. These include sanitation (e.g., the felling and removal of currently infested trees before MPB flight), pre-emptive management to reduce susceptibility before MPB arrives (e.g., thinning to reduce stand density and average tree size) and fuels reduction to remove dead fuels generated by MPB. They center on areas immediately adjacent to current infestation centers and likely the places to be first hit as the outbreak expands.
The high potential volumes surrounding current infestation centers and the low capacity of Front Range mills portend the challenges faced as we move through this outbreak. Assessing tradeoffs among different management strategies and their outcomes will be paramount. While alternative biomass industries, like biochar, show promise as an outlet for low-quality wood products, they face logistical and economic challenges at larger scales. Leaving woody residues on-site following management activities, as another potential action, impacts subsequent fire and other pest behaviors by maintaining large fuel loads in place. Practices like pile burning represent an immediate loss of stored carbon to the atmosphere. Low capacity among Front Range processing facilities will limit economic opportunities to offset treatment costs through wood utilization. This challenge is compounded by ponderosa pine’s limited market appeal relative to lodgepole and spruce, and by the geographic reality that over half of Front Range roundwood capacity sits in Fremont and Pueblo counties, well outside the core outbreak area, limiting accessible capacity further. More information on woody biomass utilization options is available from the CSFS Biomass Assessment.
This emphasizes the need for conservative approaches to cutting since treatments are likely to be expensive and resources stretched thin across varying landscapes. Collectively, this suggests that, to make the best use of limited resources, we need to effectively prioritize management spatially to have the biggest impact on outbreak progression/remediation.
Management of this outbreak will bring controversy associated with tree removal. However, by leveraging FIA data, we can begin to develop potential mitigation opportunities. Future analyses during this outbreak will consider the spatial makeup of ponderosa pine forests along the Front Range to provide land managers with areas under highest risk for current outbreaks, as well as areas most suited to potential proactive management to reduce MPB-related mortality as it arrives.
Additionally, pre-emptive management to reduce structural characteristics associated with increased infestation potential should precede MPB arrival by at least a few years for the best results. While reducing density within forests may increase resources and may temporarily boost defensive abilities immediately following treatment, these are ephemeral and subject to variability as resources fluctuate (e.g., ongoing drought). Allocation of resources to the formation of increased structural defense (i.e., resin ducts) generally lags a few years behind management actions (e.g., Vilà-Vilardell et al., 2024). We do not intend to support management for management’s sake, but the fact that mill capacity is exceedingly low highlights that treatment costs will remain high and thus the need to be targeted in our approach within both MPB-killed and current green forested stands.
Given that this potential outbreak is occurring mainly in lower-elevation ponderosa pine forests, this means a greater population will be directly impacted by increased hazards associated with tree mortality events. Short-term impacts implicate safety concerns for roadways and ingress/egress routes, complications to wildfire suppression (although, for a more complete discussion on the intersection between MPB and wildfire severity, see this Science & Data Byte), among other threats to public and private infrastructure across the state. Long-term, depending on damage, impacts may include species composition shifts, decreased ecosystem resilience and the need for reforestation, among other ecological outcomes. Therefore, assessing the current status of the outbreak and future potential impacts is important.
Not discussed in this publication is the fact that these ponderosa pine-dominant forests are not completely comprised of ponderosa pine. Colorado’s lower montane, including dry mixed-conifer forests, host a wide variety of associated tree and shrub species. Compared to the outbreak in lodgepole pine in the late 1990s, where vast acreages were comprised of largely one species, lower montane forests contain a diversity of conifers and angiosperms that may attenuate the impacts of MPB. Ponderosa pine is an important species from a climate change perspective, but the diversity of species present within these forests may help maintain ecosystem services.
Ponderosa has also been most heavily impacted by 100 years of fire suppression, which may explain the relatively low levels of age-class diversity amongst ponderosa individuals specifically within the current analysis. Coupled with targeted reforestation efforts, which will be boosted by the reopening of the CSFS Nursery in 2026, we can assist areas in recovery while simultaneously managing green forests ahead of the outbreak, thereby maintaining this key tree species on the landscape. This is to say: We do not expect the complete mortality of ponderosa pine, but we will have to deal with potential impacts for years – and decades – to come.
Limitations of this analysis
While the data presented in this Science & Data Byte are backed by robust sampling and statistical inferences from the FIA program, there are still several limitations.
- TreeMap data represent conditions that may or may not be present as they are not solely based on data collected in Colorado, nor within the jurisdictions in which they were measured. Therefore, potential acre and volume estimates are meant to serve as a rough guide for how much potential acres and volume may be impacted rather than exact numbers.
- Current stand condition data are based on field-validated FIA plots grouped by county. While there are other ways of summarizing FIA data, in order to produce county-level estimates, we draw conclusions from available plots located within each respective county, summed to the county level. Counties with low sample sizes have considerable error associated with them, and therefore the expectation is that these numbers provide a guide but are subject to much uncertainty and scrutiny.
- Ponderosa pine is not the only species at risk of MPB. Other species such as lodgepole pine and limber pine are susceptible to impacts from MPB. However, at the current moment, it is largely impacting ponderosa pine within our area of interest, so we did not include these other species. As the outbreak progresses, we will monitor to see if MPB begins to impact other species, but that is outside the scope of the current analysis.
- Our estimates of tree volume include all parts of the tree, from stump to top. These volumes represent the amount of material in total potentially available rather than just merchantable parts of the tree. These estimates are therefore representative of both the amount of material that would be taken off-site as well as left on-site, and we do not differentiate. If we were to include only merchantable material that could be taken to a mill, our estimates would be much lower but would also fail to encompass the scale of the issue.
- Our estimates of impacted acres and ponderosa pine-dominant acreage are not 1:1. Given that for our estimates of potential acreage, that we use the Negrón and Popp (2004) hazard rating infestation probability to yard pixels with plot structure that places them at high risk of beetle infestation, spatial estimates of acreage will be dictated by pixel coverage. For our estimates of ponderosa pine-dominant acreage, FIA expansion factors are used to estimate acreage. These are two different data sources, one that explicitly considers spatial distribution of forest structure (TreeMap) and one that infers it on the basis of expansion factors and is not spatially explicit (FIA FIESTA Green Book Methodology).
- Our use of Negrón and Popp (2004) probability of infestation metrics to identify FIA plots within TreeMap that are at high risk only partially identifies overall risk. There are many areas that will not necessarily meet these thresholds and still face damage, while other areas may meet these thresholds and suffer relatively little damage. This gives us a rough estimate of a range of potential future impacts upon which we can start to understand in the next few years. Not every individual ponderosa, nor every acre within our buffers, will become infested; however, those areas currently adjacent to ongoing outbreaks are likely the areas to be infested next.
Reviewers and experts consulted:
-
Zach Smith, Forest Health Program Associate, Colorado State Forest Service
-
Ben Irey, Research Social Scientist, Bureau of Business and Economic Research, University of Montana
-
Phoebe Bauer, GIS Analyst, Colorado State Forest Service
References
Amman, G. (1973). Population changes of the mountain pine beetle in relation to elevation. Environmental Entomology, 2(4), 541-547.
Bechtold, W. A., & Patterson, P. L. (2005). The enhanced Forest Inventory and Analysis program – national sampling design and estimation procedures. USDA Forest Service.
Houtman, Rachel M.; Leatherman, Lila S. T.; Zimmer, Scott N.; Housman, Ian W.; Shrestha, Abhinav; Shaw, John D.; Riley, Karin L. 2025. TreeMap 2022 CONUS: A tree-level model of the forests of the conterminous United States circa 2022. Fort Collins, CO: Forest Service Research Data Archive.
Irey, B. T., Townsend, L., Dillon, T., Scott, S. G., Simmons, E. A., Morgan, T. A., & Shaw, J. D. (2025). Colorado’s timber harvest and forest products industry, 2020. USDA Forest Service.
Negrón, J. F., & Cain, B. (2019). Mountain pine beetle in Colorado: A story of changing forests. Journal of Forestry, 117(2), 144–151.
Negrón, J. F., & Popp, J. B. (2004). Probability of ponderosa pine infestation by mountain pine beetle in the Colorado Front Range. Forest Ecology and Management, 191(1–3), 17–27.
NOAA National Centers for Environmental information, Climate at a Glance: Statewide Time Series, published April 2026, retrieved on April 29, 2026.
Schumacher, R. (2026, February 9). How does this year compare to the snow droughts of the past? Colorado Climate Blog.
USDA Forest Service, Forest Health Protection and its partners. (2026, January 27). Aerial detection survey: 2025. U.S. Department of Agriculture.
Vilà-Vilardell, L., Tepley, A. J., Sala, A., Casals, P., & Hood, S. M. (2024). Long-term sensitivity of ponderosa pine axial resin ducts to harvesting and prescribed burning. Forest Ecology and Management, 572, 122301.
Withrow, R. J., Lundquist, J. E., & Negrón, J. F. (2013). Spatial dispersal of Douglas-fir beetle populations in Colorado and Wyoming. ISRN Forestry, 2013, Article 542380, 1–10.