Rural FIA

Data collected from FIA plot surveys supports a wide range of scientific research and is publicly available. U.S. Forest Service FIA analysts evaluate these data to produce state-level reports mandated by Congress, as well as estimation tools and downloadable datasets (FIA Data and Tools) for public use. FIA data contributes to research on:
- Potential wildfire hazards
- Wildlife habitat conditions
- Causes of tree mortality, including insects and diseases
- Biomass estimates and carbon storage
- Timber volume and resource estimates
- Numerous other scientific and management efforts across federal and state agencies, universities and private industry
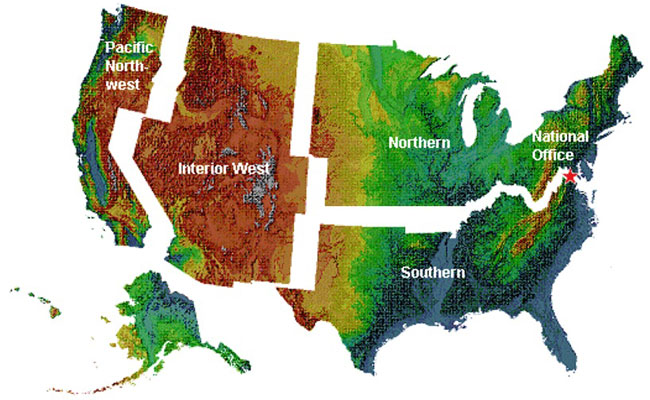
The national FIA Program is organized into five regional units: Pacific Northwest, Interior West, Northern, Southern and the National Office. The Interior West FIA (IW-FIA) unit — part of the USFS Rocky Mountain Research Station — conducts and continuously updates a comprehensive inventory and analysis of current and future conditions of forest and rangeland resources across the region. This unit is responsible for inventories in Arizona, Colorado, Idaho, Montana, Nevada, New Mexico, Utah and Wyoming.
Plot selection
The Farm Bill of 1998 mandated changes to inventory procedures and formally integrated the Forest Inventory and Analysis (FIA) program with the complementary Forest Health Monitoring (FHM) program. To reduce bias and ensure statistically robust data, a hexagonal lattice framework was established across the conterminous United States, providing a consistent and scientifically rigorous sampling design.

Each hexagon in the FIA framework is spaced 3.27 miles apart from its center and covers approximately 6,000 acres. A FIA plot is placed within each hexagon, regardless of landscape features or land ownership. To preserve historical data and track changes over time, FIA also incorporates older FHM plots into the hexagonal grid design. Once the plots are determined, the FIA program is conducted in two main phases:
Phase 1 (P1)
In this phase, office-based work is used to remotely identify plots that are potentially forested. Given the random placement of plots, some will fall in non-forested areas such as water bodies, agricultural fields, open meadows, or even parking lots. These non-forested plots are removed from the survey, while plots that are likely to be forested move on to the next phase.
Phase 2 (P2)
Plots that pass the P1 screening are visited by field crews. Upon arrival, experienced teams assess whether the plot qualifies as forested land. To meet the FIA definition of “forested,” the area must be at least one acre in size, 120 feet wide, and have a minimum of 10% canopy cover of qualifying tree species. If the plot meets these criteria, the crew proceeds with data collection on various forest attributes.
Phase 2 + Soils (P2 + Soils)
A subset of P2 plots, known as P2+Soils plots, undergoes additional data collection focused on soil characteristics. This includes measurements of soil depth to restrictive layers, soil texture, and the nutrient content of duff and litter.
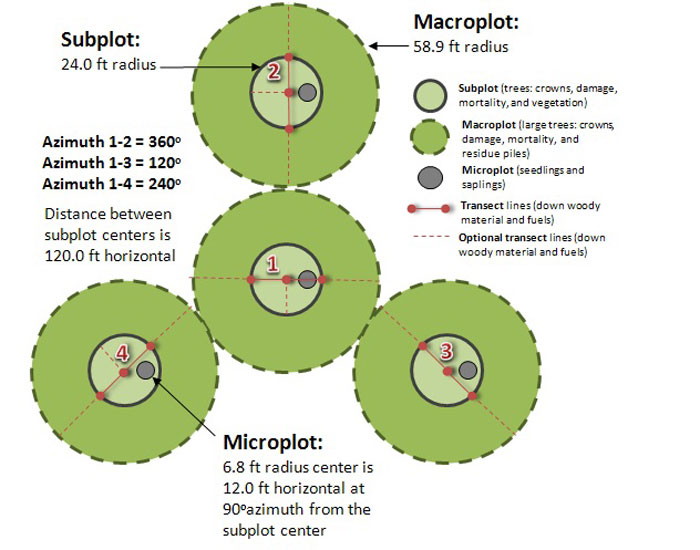
Plot design
Each FIA plot represents a potential sample area of 2.47 acres and follows a nested sampling design, which includes several levels: a hectare plot (not shown), macroplot, subplot, microplot, and transects. The data collected from these smaller sample areas are then extrapolated to represent approximately 6,000 acres. This 4-point plot design was adopted nationwide by FIA in 1995 to ensure consistency and statistical reliability across the program.